SRM University, Chennai Law UG 2026
NAAC A++ Accredited | Ranked #11 by NIRF


Want to know which Maths topics matter most for CLAT 2027? Analysing CLAT 2025 and CLAT 2026 question papers can help candidates to focus on CLAT 2027 preparation on the most relevant question types. CLAT 2027 Quantitative Techniques section is expected to carry around 10 to 14 questions, accounting for approximately 10% of the CLAT 2027 question paper. The CLAT 2027 maths syllabus includes areas such as ratios & proportion, elementary algebra, mensuration, and statistical estimations.
This Story also Contains
The CLAT 2027 candidates can refer to the CLAT 2025 & CLAT 2026 question papers to prepare themselves for CLAT 2027. The CLAT previous year question papers will provide insight into the numerical questions asked in the examination. However, the exact CLAT questions and topic-wise distribution may vary year to year.
The table below provides the weightage, number of questions and the list of topics from which questions can be asked in the CLAT 2027, based on CLAT 2025 and 2026.
Particulars | Details |
Number of Questions asked | 10-12 questions in the CLAT are asked from the Quantitative Aptitude section |
Weightage in the paper | The weightage is 10% of the CLAT question paper |
Types of questions asked | The types of questions include a set of facts, representations, figures, graphs and equations |
Topics from which questions are asked |
|
CLAT 2027 aspirants can download the PDF and practise CLAT 2027 Maths Questions to strengthen their preparation and improve their problem-solving skills.
CLAT 2027 Maths Questions PDF |
In the last two years, the CLAT maths section focused on applying mathematical principles to numerical data.
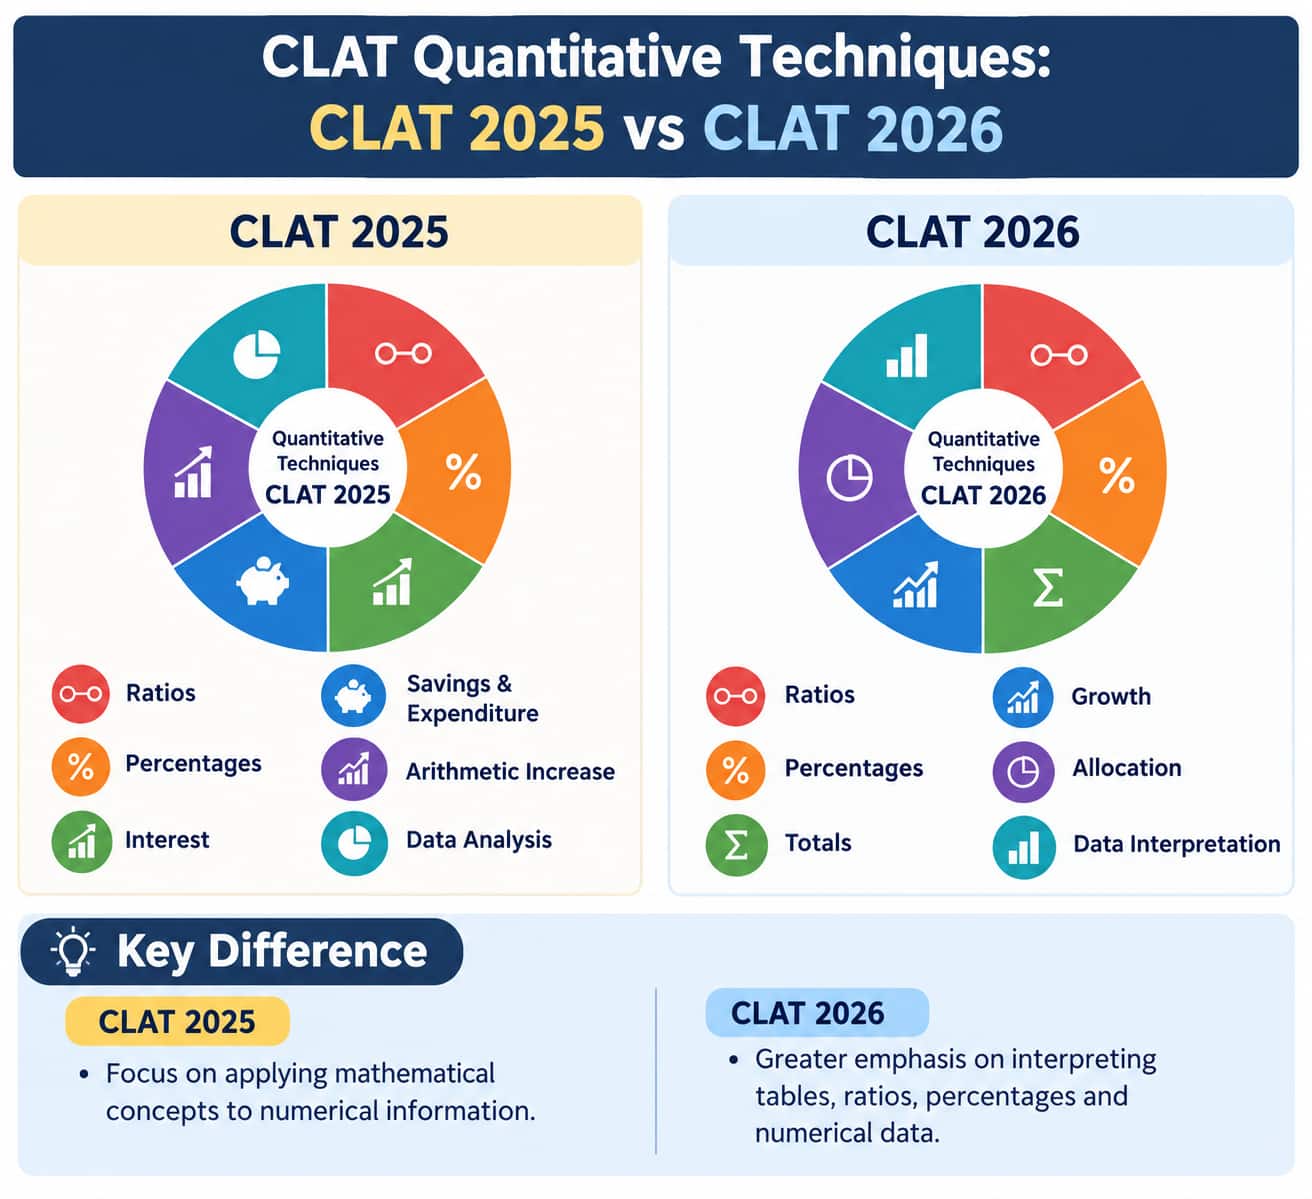
The CLAT 2027 last 5 years question paper trends indicates that the interpretation of data and basic mathematics remained relevant in both years. While percentages and ratios were repeated, candidates also needed to understand the numerical data before doing any calculations. The CLAT 2025 paper also covered aspects such as interest, savings and expenditure, whereas the CLAT 2026 paper focused more on tables, sums, increase and allocation.
Below are the CLAT 2027 Mathematics questions based on the topics covered in CLAT 2025 and CLAT 2026.
Directions:- A survey was conducted about the population of a particular region having a working population of three lacs and information was collected about self-employed persons, capital wage workers, and regular salaries employees of both urban and rural areas of the region. Self-employment is a key source of income in both rural and urban arses but it is more prevalent in rural areas (56% of the rural population) than in urban areas (40% of the urban population). The rural population was 48% of the total population. Regular salaried workers in urban areas were 48% of the urban population, whereas in rural areas, regular salaried workers constituted 12% of the rural population. During the survey, the casual wage workers: were found to be more common in rural areas than in urban areas. Casual wage workers in rural areas were 32% of the rural population whereas it was 12% of the urban population. in urban areas.
Based on the above information, answer the following question.
Question:- By what percentage the number of self-employed workers in rural areas is more than the number of self-employed workers in urban areas?
29.23
33.24
35.01
34.32
Answer: 1) 29.23%
The rural population is 48 of the total population.
Therefore, urban population is:
100
Self-employed workers in rural areas:
56
Self-employed workers in urban areas:
40
Difference:
0.2688−0.208=0.0608
Percentage by which rural self-employed workers are more than urban self-employed workers:
0.06080.208×100
=29.23%
Final Answer: 29.23%
Health insurance plays a vital role in ensuring financial protection and access to quality healthcare. In India, however, the extent and nature of health insurance coverage vary significantly between urban and rural areas. While urban populations often have better access to organised insurance schemes, employer-provided coverage, and awareness about health policies, rural populations face challenges such as limited outreach of insurance schemes, inadequate infrastructure, and lower awareness levels. This urban-rural divide in health insurance coverage highlights the broader issue of healthcare inequality, making it essential to analyse the factors contributing to this gap and explore strategies for more inclusive health protection. A state-level health survey was conducted.
The survey covered 1,80,000 adults across urban and rural areas. Urban residents formed 55% of the sample (that is, 99,000 people) while rural residents made up 45% (that is, 81,000 people). In each area, coverage was classified under four heads - Public schemes, Private insurance, Employer-provided coverage, and Uninsured. In urban areas, Public coverage accounted for 28 of the urban population, Private for 22, Employer for 18%, and the remaining 32% were Uninsured. In rural areas, where formal coverage is generally lower, Public coverage stood at 35, Private at 10, Employer at 8, while 47 were Uninsured. For this survey, "Insured" includes everyone covered by Public + Private + Employer schemes, and "Uninsured" indicates those with no coverage at all. Officials noted that public schemes remain the backbone of rural coverage, while employer and private plans are relatively more prevalent in urban centres.
Question: By what percentage is the number of Uninsured in Rural higher than Uninsured in Urban?
18.75%
20.17%
22.50%
25.00%
Answer: 2) 20.17%
Total urban population:
1,80,000×55%=99,000
Total rural population:
1,80,000×45%=81,000
Uninsured urban population:
99,000×32%
=31,680
Uninsured rural population:
81,000×47%
=38,070
Difference:
38,070-31,680=6,390
Percentage by which rural uninsured population is higher:
6,39031,680100
=20.17%
Final Answer: 20.17%
Direction
Automobiles are the most preferred mode of transport because they allow us to cover large distances quickly. Resultantly, vehicles have been developed that run on diesel, petrol and even on electricity, which is a remarkable innovative development. During a survey about the percentage-wise distribution of cars in four different states, information regarding the ratio between diesel engine cars, petrol engine cars and electric cars was collected. Total number of cars for which data was collected was 8000. Of these, State 1 had 15% of the total cars in the ratio of 3 : 4 : 1 (diesel, petrol and electric); State 2 had 20 % of the total cars in the ratio of 5 : 3 : 2 (diesel, petrol and electric); State 3 had 30% of the total cars in the ratio of 4 : 5 : 3 (diesel, petrol and electric), and; State 4 had 35% of the total cars in the ratio of 7 : 5 : 2 (diesel, petrol and electric).
Based on the above information, answer the following question.
Question:- What is the ratio of diesel cars in State 4 to electric cars in State 3?
7 : 3
3 : 7
7 : 4
4 : 7
Answer: 1) 7 : 3
Total cars: 8,000
State 4 has 35% of the total cars:
8,000×35%=2,800
For State 4, the ratio of diesel : petrol : electric cars is 7:5:2.
Total ratio:
7+5+2=14
Diesel cars in State 4:
7142,800=1,400
State 3 has 30 of the total cars:
8,000×30%=2,400
For State 3, the ratio is 4:5:3.
Total ratio:
4+5+3=12
Electric cars in State 3:
3122,400=600
Therefore, the required ratio is:
1,400:600
=14:6
=7:3
Final Answer: 7 : 3
Direction
Automobiles are the most preferred mode of transport because they allow us to cover large distances quickly. Resultantly, vehicles have been developed that run on diesel, petrol and even on electricity, which is a remarkable innovative development. During a survey about the percentage-wise distribution of cars in four different states, information regarding the ratio between diesel engine cars, petrol engine cars and electric cars was collected. The total number of cars for which data was collected was 8000. Of these, State 1 had 15% of the total cars in the ratio of 3 : 4 : 1 (diesel, petrol and electric); State 2 had 20 % of the total cars in the ratio of 5 : 3 : 2 (diesel, petrol and electric); State 3 had 30% of the total cars in the ratio of 4 : 5 : 3 (diesel, petrol and electric), and; State 4 had 35% of the total cars in the ratio of 7 : 5 : 2 (diesel, petrol and electric).
Based on the above information, answer the following question.
Question:- What is the average number of diesel cars in all the States?
810
862.5
886
912.5
Answer: 2) 862.5
Total cars: 8,000
Total cars:
8,000×15%=1,200
Diesel cars:
33+4+11,200
=381,200
=450
Total cars:
8,000×20%=1,600
Diesel cars:
55+3+21,600
=5101,600
=800
Total cars:
8,000×30%=2,400
Diesel cars:
44+5+32,400
=4122,400
=800
Total cars:
8,000×35%=2,800
Diesel cars:
77+5+22,800
=7142,800
=1,400
Total diesel cars:
450+800+800+1,400=3,450
Average:
3,4504=862.5
Final Answer: 862.5
Direction
A survey was conducted in a particular region having a working population of three lakh. Information was collected about self-employed persons, casual wage workers, and regular salaried employees in both rural and urban areas.
If 60% of the total working population were self-employed in rural areas and 40% of the total working population were self-employed in urban areas, what is the ratio of rural self-employed workers to urban self-employed workers?
Based on the above information, answer the following question.
Question:- If 60% of the total working population of the region were self-employed in rural areas and 40% of the total population were self-employed in urban areas, then what is the ratio of rural self-employed to urban self-employed?
2 : 3
3 : 2
13 : 18
18 : 13
Answer: 2) 3:2
The total working population is 3,00,000.
Rural self-employed workers:
60% of 3,00,000=601003,00,000
=1,80,000
Urban self-employed workers:
40% of 300000=401003,00,000
=1,20,000
Therefore, the required ratio is: 1,80,000:1,20,000
Dividing both terms by 60,000: =3:2
Hence, the required ratio is: 3:2.
Direction:- A survey was conducted about the population of a particular region having a working population of three lacs and information was collected about self-employed persons, capital wage workers, and regular salaries employees of both urban and rural areas of the region. Self-employment is a key source of income in both rural and urban arses but it is more prevalent in rural areas (56% of the rural population) than in urban areas (40% of the urban population). The rural population was 48% of the total population. Regular salaried workers in urban areas were 48% of the urban population whereas in rural areas, regular salaried workers constituted 12% of the rural population. During the survey, the casual wage workers: were found to be more common in rural areas than in urban areas. Casual wage workers in rural areas were 32% of the rural population whereas it was 12% of the urban population. in urban areas.
Based on the above information, answer the following question.
Question:- What is the ratio of urban and rural working population?
12 : 13
11 : 12
13 : 12
03 : 08
Answer: 3) 13:12
Rural areas population = 48% of 300000 = 144000
Urban population = 52% of 300000 = 156000
Self-employed in rural areas = 56% of 144000 = 80640
Self -employed in urban areas = 40% of 156000 = 62400
Regular salaried in urban areas = 48% of 156000 = 74880
Regular salaried in rural areas = 12% of 144000 = 17280
Casual wage workers in rural areas = 32% of 144000 = 46080
Casual wage workers in urban areas = 12% of 156000 = 18720
Rural=144000 | Urban = 156000 | |
Self-employed | 80640 | 62400 |
Casual wages workers | 46080 | 18720 |
Regular salaries | 17280 | 74880 |
Required ratio = 156000:144000 = 13 : 12
Hence, the correct answer is 13 : 12
Directions: An Indian company, having its registered office at Gurugram, is engaged in the manufacturing of consumer goods in Noida. The goods manufactured by the company are sold in the Indian market and exported to Europe. The company produces five products namely 'P',' Q,', R ', 'S' and ' T '. The total production of the company for the financial year 2021-22 is 3,000 tonnes and the turnover of the company is 50 million. An analysis of the production and net revenue generation shows that production of product ' P ' is 21 % of the total production and 18 % of the turnover is attributable to product ' P '; production of ' Q ' is 16 % of the total production and 17 % of the turnover is attributable to ' Q '; ' R ' accounts for 18 % of the total production and 20 % of the turnover; 'S' accounts for 20 % of the total production and 25 % of the turnover, and; ' T ' accounts for 25 % of total production and 20 % of turnover.
Question: What is the percentage of profit earned from the sale of ' R ', if the expenditure incurred on production of ' R ' is 15,000 /- per tonne?
19%
23.46%
26.55%
25%
Answer: 1) 19%
Total production: 3,000 tonnes
Total turnover: ₹50 million
Production and Turnover Data:
Product 'P': 21% of production, 18% of turnover
Product 'Q': 16% of production, 17% of turnover
Product 'R': 18% of production, 20% of turnover
Product 'S': 20% of production, 25% of turnover
Product 'T': 25% of production, 20% of turnover
Production of 'R': = 18% of 3000=0.18 × 3000 = 540 tonnes
Turnover from 'R' = 20% of 50,000,000=0.20 × 50,000,000=Rs 10,000,000
Expenditure on the production of 'R ’= 540 × 15,000= Rs 8,100,000
Profit from ’R’=10,000,000 − 8,100,000 = Rs. 1,900,000
Percentage of Profit = 190000010000000 × 100 = 19%
Hence, the correct answer is option (1).
Directions: World fruit production went up 54 percent between 2000 and 2019, to 883 million tonnes. Five fruit species accounted for 57 percent of the total production in 2019, down from 63 percent in 2000. Use the data in the passage to answer the following questions.
Question: Frutopia and Fruitfix both sold oranges at the same selling price. However, Frutopia gave customers a 15% discount on the marked price whereas Fruitfix sold the oranges for a discount of 20% on the marked price. If the marked price of oranges on Frutopia is Rs. 75/kg, what is the marked price of oranges on Fruitfix?
Rs.78
Rs.82
Rs.90
Rs.80
Answer: 4) Rs. 80
Let p be the marked price for Fruitfix. Frutopia sells at: 750.85=63.75
For Fruitfix, selling at 0.80 of the marked price equals 63.75 0.8p=63.75
Solving for p:
p=63.750.8=79.6875≈80
Hence, the correct answer is option (4).
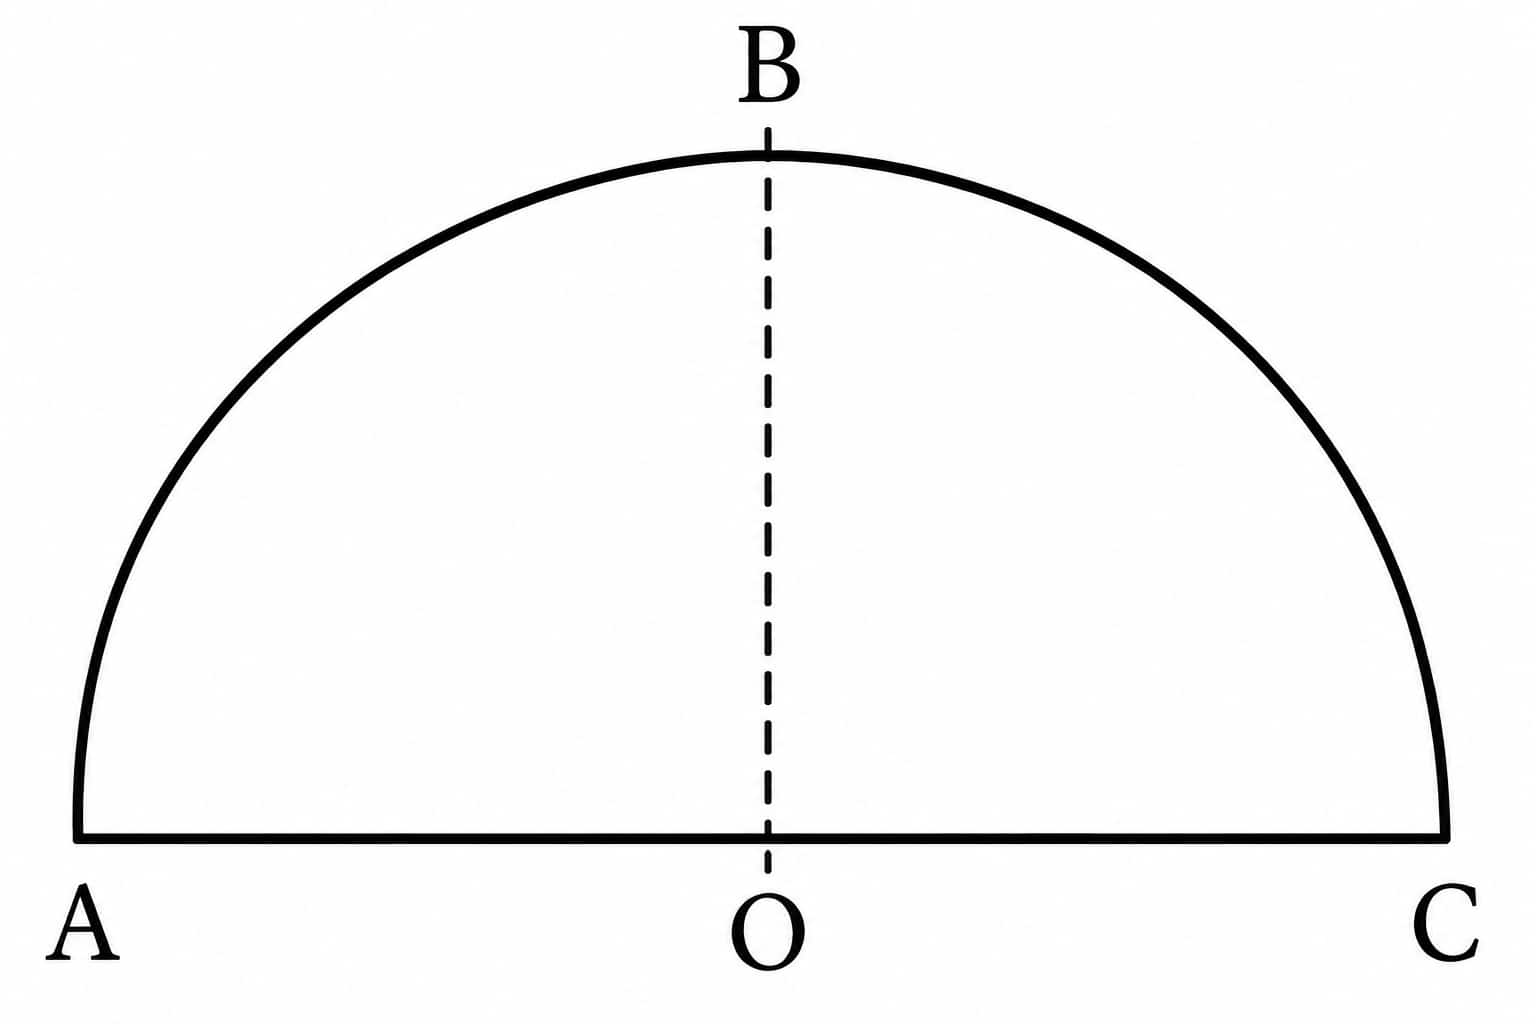
Direction: In the figure given below, a goat is tied to a pole (at point O) which is the centre of the semi-circular plot. The area of the plot is numerically equal to its perimeter. BO is the length of the rope through which the goat is tied to the pole. Answer to the closest decimal.
Figure: Semicircular plot ABC with O at the centre of AC and BO as the radius/rope.
Question: What will be the area of the triangle ABC?
6.96
9.66
3.66
Can't be calculated with the given data
Answer: 2) 9.66
Area of the semicircular plot: Area =12πR2
The perimeter of the semicircular plot (including the diameter AC ): Perimeter =R+2R
Given that the area is equal to the perimeter: 12πR2=πR+2R
Simplify this equation: 12πR2=R(π+2)
Divide both sides by (assuming R is not equal to 0 ) =12πR=π+2
Multiply both sides by 2 : R=2(+2)
∴R=2(π+2)π=2+4π=3.28
Area = 12AC OB=OB2=3.282=10.75
The closest option is: 9.66
Hence, the correct answer is option (2).
A state electricity report serves as an important tool to assess energy production and track progress in the power sector. By providing quarterly data on generation measured in gigawatt hours (GWh), the report highlights the contribution of different energy sources such as coal, gas, hydro, solar, and wind. This not only helps in understanding the overall energy mix and dependence on conventional versus renewable sources but also enables policymakers, planners, and stakeholders to evaluate trends, address gaps, and promote sustainable energy development. A state electricity report provides quarterly generation (in GWh) by source - Coal, Gas, Hydro, Solar, and Wind.
In Q1 Generation from Coal is 2,000 GWh, Gas contributes 800 GWh, Hydro 900 GWh, Solar 700 GWh, and Wind 400 GWh, for a total of 5,000 GWh.
In Q2 Coal rises to 2,400 GWh, while Gas dips to 700 GWh; Hydro improves to 1,000 GWh, Solar to 800 GWh, and Wind to 600 GWh, bringing the quarterly total to 5,500 GWh.
In Q3 Coal moderates to 2,100 GWh, Gas increases to 900 GWh, Hydro softens to 800 GWh, but Solar advances to 1,000 GWh and Wind to 700 GWh, keeping the total at 5,500 GWh.
In Q4 Coal moves to 2,300 GWh, Gas to 850 GWh, Hydro to 1,100 GWh, Solar to 900 GWh, and Wind to 850 GWh, for a total of 6,000 GWh.
For analysis, Renewables are taken as Hydro + Solar + Wind. A carbon policy scenario proposes cutting Q4 Coal by 10%, shifting the entire reduction equally into Solar and Wind.
Question: The overall renewable share (as % of annual generation) is closest to:
42.5%
43.8%
44.3%
45.0%
Answer: 3) 44.3%
Renewables per quarter:
Q1 =900+700+600=2200 Q2 =900+800+600=2300 Q3 =800+900+700=2400 Q4 =1100+900+850=2850
Total renewables =2200+2300+2400+2850=9750
Total generation = 22000
Renewable %=(9750÷22000)×100=44.3%
Hence, the correct answer is option (C).
Gaining proficiency in effective calculation techniques is essential for success in the CLAT 2027 quantitative techniques part. Here are three practical methods to improve your accuracy and speed:
Methods | Explanation | Examples |
Digit Sum Method | This method entails repeatedly adding up a number's digits until a single-digit result is achieved. It facilitates fast error detection and calculation verification. | For 1238, sum the digits: 1 + 2 + 3 + 8 = 14 → 1 + 4 = 5. To verify 1238 × 46 = 56848:
|
Unit Digit Method | To find the unit digit of the outcome of operations like multiplication and exponentiation, pay attention to the unit digits of the integers. | To find the unit digit of 23 × 47:
|
Approximation Method | Rounding integers to the closest ten, hundred, or thousand simplifies complicated computations and facilitates rapid estimation of responses. | To calculate 37% of 218:
|
Vedic Multiplication | Use patterns like cross-multiplication to quickly multiply 2-digit numbers | 23 × 11 = 253 |
Percentage Approximation | Learn shortcuts for 5%, 10%, 25%, 50% etc | 10% of 360 = 36 |
Quick Square Roots | Memorise squares till 25 and cube roots till 10 | √625 = 25 |
Unit Digit Method | Focus only on unit digits when eliminating options | 17² ends in 9 (7² = 49) |
Given below are the CLAT 2027 Maths Important topics that CLAT 2027 aspirants should practice.
Percentages form a significant topic for CLAT Quantitative Techniques. The candidates must practice problems of percentage increase/decrease and percentage-based comparison and interpretation.
Ratio and proportion topics are particularly specified in the CLAT 2027 syllabus. Practice questions on comparison, distribution, and relationship between two quantities.
Problems relating to averages may involve calculating or comparing the average of some given values. The speed of calculations may also be increased through regular practice.
The syllabus for CLAT 2027 includes basics of algebra. One should go through the basics of equations and algebra at the 10th-grade level.
Students need to go through some revision of the basics of mensuration, especially those relating to areas, perimeters, and other related concepts.
Data interpretation is required since data-related questions have appeared in the CLAT Quantitative Techniques section recently. Practice finding totals, comparisons between values, percentages and trends from the data provided.
Interest calculations have been seen recently in the CLAT Quantitative Techniques section. Students need to revise the basics of interest, profit, loss, and expenditure.
Out of all the best-recommended books for CLAT 2027, the following are retrieved, focusing specifically on CLAT 2027 Maths preparation.
Books | Name of the Author |
Quantitative Aptitude for competitive examinations | RS Agarwala |
30 days wonder for maths | S. Chand |
Fast Track Objective Arithmetic | Arihant Publications |
Also check:

On Question asked by student community
Hello student,
CLAT 2027 aspirants can access these monthly current affairs compilations for regular revision. Use these resources to stay updated with important events and topics for CLAT 2027.
|
Particular |
Download PDF |
|
CLAT Current Affairs- August Month (2026) |
|
|
CLAT Current Affairs- |
If you have only two months, use a highly structured plan: daily current affairs, English reading, legal reasoning practice, logical reasoning sets, basic quantitative practice and regular full-length mocks. Spend as much time analysing incorrect questions as taking the mock itself. Consistency during these two months can make a substantial
You can download the CLAT previous years' question papers from here:
https://law.careers360.com/articles/clat-previous-year-question-papers
https://law.careers360.com/download/clat-sample-papers-previous-years
For CLAT 2027 UG, candidates need to have passed Class 12/equivalent with at least 45% marks, or 40% for SC/ST/PwD candidates.
In your situation, having an RT in an additional subject but subsequently passing the required qualification through an improvement examination does not automatically make you ineligible. However, the important
Here's the link to download the CLAT mock test:

Approved by BCI | Ranked #4 among Law Institutes in UP | NAAC A+ Accredited
Ranked 1 st among Top Law Schools of super Excellence in India - GHRDC | NAAC A+ Accredited | #36 by NIRF
Admission Against Cancellation/Lapsed Seats | Pay 500 Application Fee instead of ₹1500 | NIRF Ranked 87 | NAAC A+ Grade | Upto 100% scholarship
Application Closing on 30th Jul'26 | Approved by Bar Council of India | 100% Scholarship | Accepts CLAT Scores | Few Seats Left!
NAAC A+ Accredited | Students | Moot Court Session | Legal Aid Clinics | | Scholarships to Meritorious
Last Date to Apply: 17th August | QS I-Gauge Diamond Rated | NAAC A+ Accredited | 621 Recruitment Partners | INR 40 LPA Highest CTC | 4482 Job offers